Setup Graylog in K8s and Istio
Background
系列文章第2篇. 本文讲述如何在K8s下搭建Graylog, 作为demo环境; 并配置Istio ingress使其internet accessible.
主要内容:
- Graylog基础
- GKE创建K8s+Istion
- Deploy Graylog, 及dependency: mongo和elasticsearch
- 运行demo app, 确认日志到达Graylog
Introduction to Graylog
Graylog, 开源的日志一体化解决方案,其实是 Graylog stack, 包含:
- Graylog本身: UI, config management
- MongoDB: 存储Graylog metadata(非log data)
- ElasticSearch: 存储log, searching engine
Graylog’s Input
Very flexible, 支持常见的format:
- Ingest syslog
- Ingest journald
- Ingest Raw/Plaintext
- Ingest GELF: TCP, UDP, HTTP, Kafka
- Ingest from files
- Ingest JSON path from HTTP API
- AWS logs
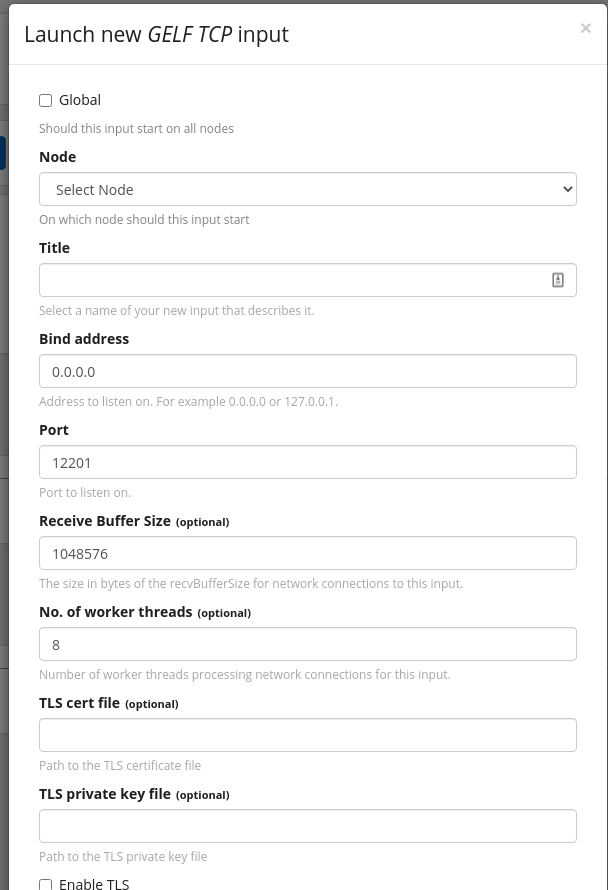
Graylog可以config多个input; 每个Input独立accept message;
如GELF TCP, 需config bind addr, port, tls等; Config完成后, Graylog会listen此addr+port.
Graylog Streams
Graylog存储时支持logging message分离, 分为不同的stream(每个stream ElasticSearch有独立的index);
即分治法, 将logging message按自定义规则group为不同的逻辑分组,如 HTTP500, HTTP200; 搜索时只搜索HTTP500, 没必要每次全局搜索.
Note:
- Graylog可以config多个stream, stream间独立
- 每个incoming message都会根据routing rule, route到特定的stream
- 一个Message可以被route到多个stream
e.g following message:
1 | message: INSERT failed (out of disk space) |
只想看DB error, create a stream, rule为:
- Field level must be greater than
4 - Field source must match regular expression
^database-host-\d+
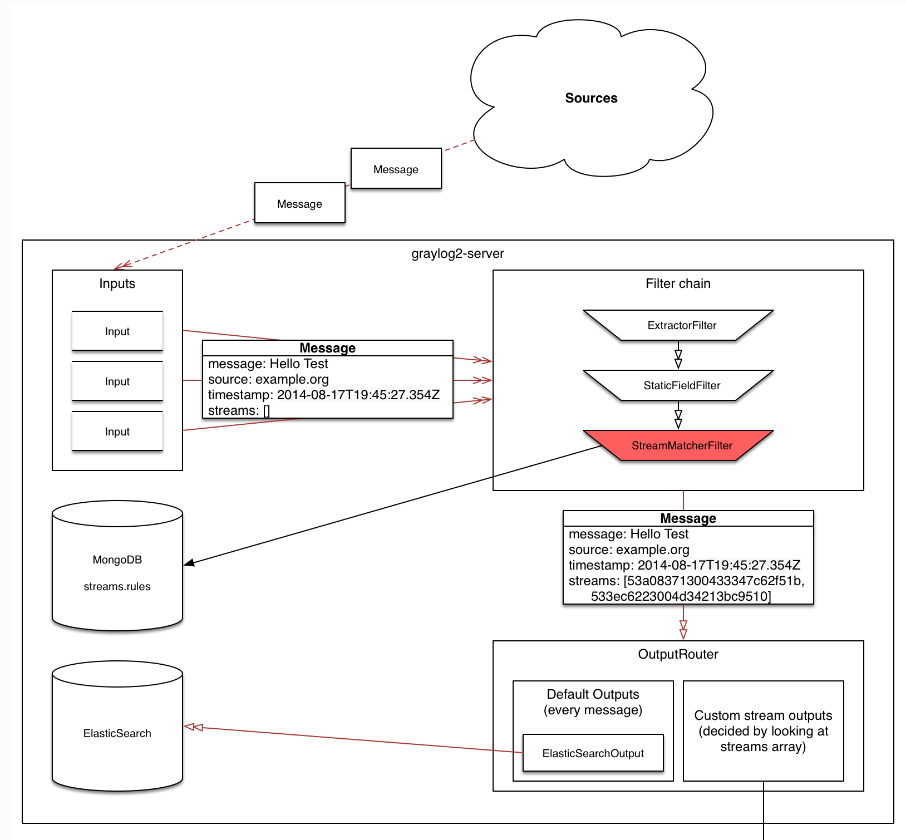
Graylog stream matching其实是为message add field: array type streams, 存储stream的ID. 后续ElasticSearch可以根据此field建立索引.
Demo version
- Kubernetes: 1.19
- Graylog: 3.0
- MongoDB: 3
- ElasticSearch: 6.7.2
All demo code can be downloaded in github
Graylog in Docker
官方文档提供了Graylog的docker-compose file:
1 | version: '3' |
Note:
- 本地放访问URL需要与
GRAYLOG_HTTP_EXTERNAL_URI设置的一致,localhost无法访问127.0.0.1 - 初始ID/Pass: admin/admin
Create Kubernetes on GKE
1 | # create cluster, v1.17 |
Note:
- 需要安装gcloud, Istioctl 1.7, kubectl的两个插件: ctx, ns
- Istio默认安装好后会spinup LB, 作为cluster的ingress point; 我们需要记录下来之后config graylog
- 此脚本将当前context设置为新建立的cluster, 并命名为
Deploy Graylog in K8s
首先create demo namespace: k create ns graylog-demo
Deploy Graylog dependent component, 代码在这里下载:
1 | k apply -f mongo-deploy.yaml |
修改graylog-deploy.yaml, 设置GRAYLOG_HTTP_EXTERNAL_URI为ingress-controller的IP addr, 即上一步得到的$URL, e.g:
1 | - name: GRAYLOG_HTTP_EXTERNAL_URI |
Deploy graylog: k apply -f graylog-deploy.yaml
确认deploy正常: k get pods -w
1 | NAME READY STATUS RESTARTS AGE |
Config Istio Ingress
Istio默认安装提供了ingress controller, 我们需要配置route, 将HTTP request引入到Graylog中:
1 | apiVersion: networking.istio.io/v1alpha3 |
- Gateway用来设置ingress-controller的listen port: listen
80端口 - VirtualService设置listen port的routing rule: route到K8s service
graylog3(k8s service 对应内部DNS name)
回顾graylog3定义:
1 | apiVersion: v1 |
Port 80 route到Pod 9000端口,即Graylog的Web UI.
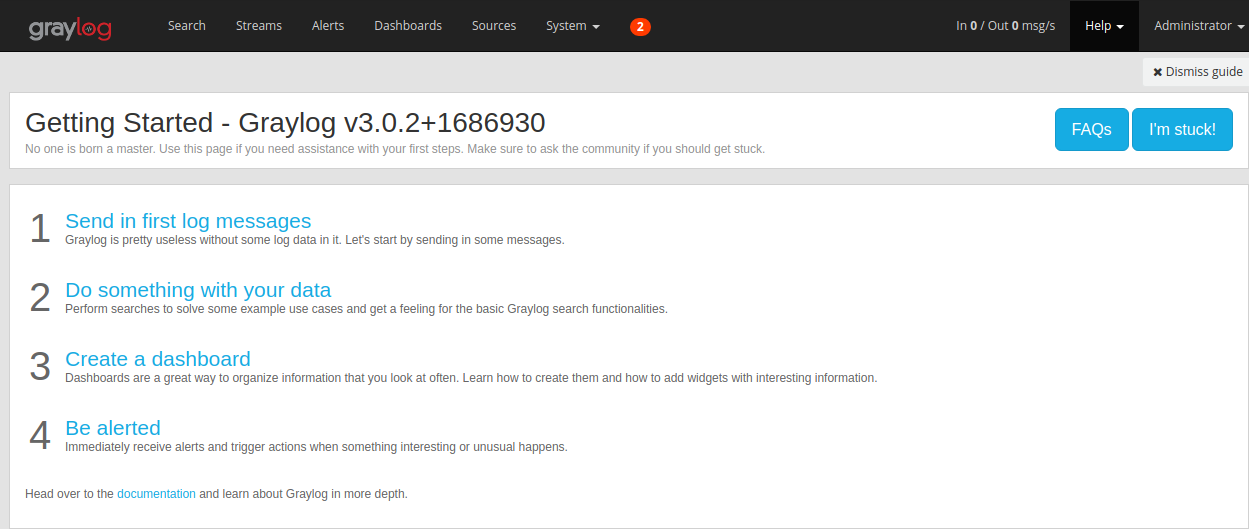
我们访问http://34.116.94.91即可看到Graylog dashboard, ID/Pass: admin/admin
到此,我们Graylog demo deploy完成; 工作环境需要给Graylog stack附加持久化存储,即PVC.
Structured log and GELF
一般建议log输出为JSON, 并采用structure log: 即将关键信息分离到各个fields, 而不是混合输出为同一个fields
不可取:
1 | log.Errorf("requestID %s failed with HTTP code %d", requestID, httpCode) |
应该:
1 | log.WithField("requestID", %s). |
而GELF是Graylog建议的log fields”约定”, 遵循structured log, 标准化一些fields, 用来替代之前流行的syslog标准:
- GELF message是JSON string
- GELF内置data types, log需要遵循data type约定,否则Graylog parse时会报错
- Mandatory fields:
- version: type
string (UTF-8), GELF spec version, e.g1.1 - host: type
string (UTF-8), name of the host, source or application - short_message:
string (UTF-8), short descriptive message
- Optional GELF fields
- full_message:
- timestamp:
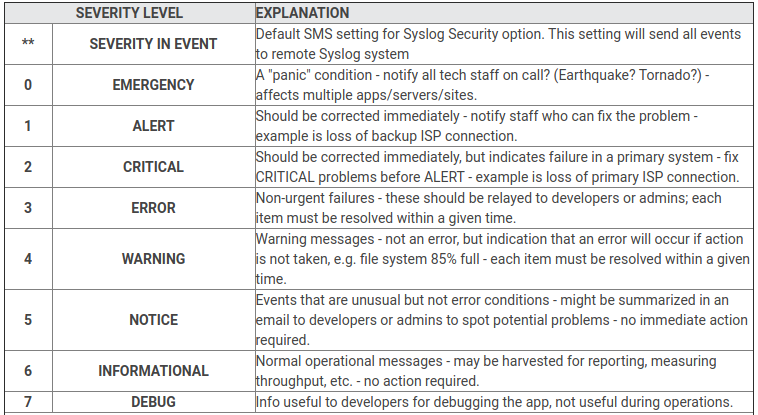
- level: type
number, standard syslog levels, DEFAULT 1 (ALERT) - _[additional field] : Other custom fields + type
stringornumber, 程序自定义的fields + Log library需要给fields附加prefix_
Example GELF message payload:
1 | { |
Syslog的severity level:
本文的Demo设置Graylog 接受GELF TCP, 即用TCP协议传输log message, 可以直接测试 via TCP message:
1 | echo -n -e '{ "version": "1.1", "host": "example.org", "short_message": "A short message", "level": 5, "_some_info": "foo" }'"\0" | nc -w0 graylog.example.com 12201 |
Send logs in k8s cluster to graylog
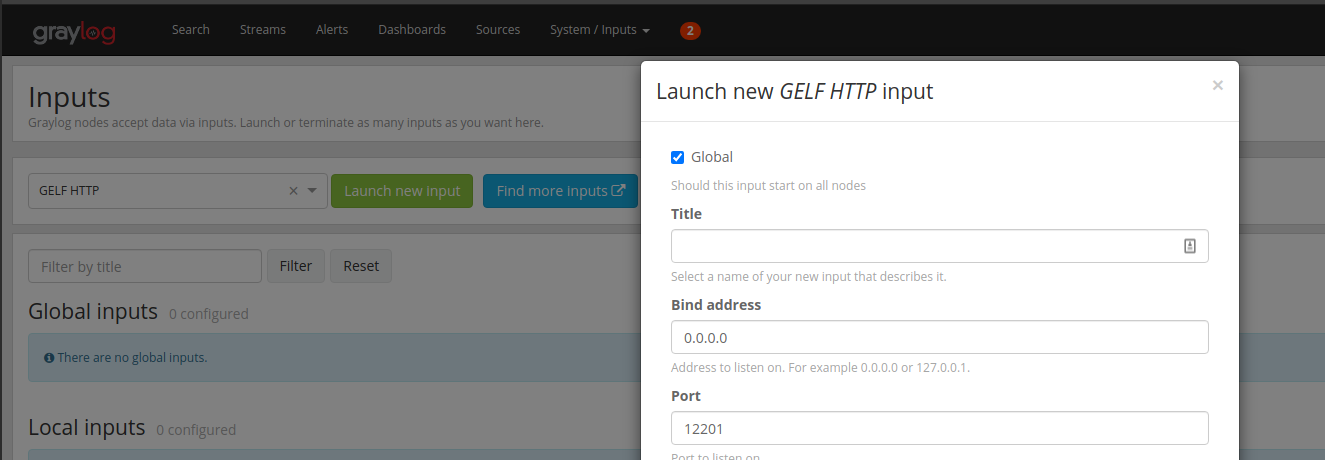
Config Graylog Input
Setup 两个Input: HTTP 和 TCP
GELF HTTP, listen 12201
Send log directly via cronjob
我们设置cronjob来通过HTTP向Graylog发送日志, using GELF format
1 | apiVersion: batch/v1beta1 |
Create cronjob: k apply -f log_generate_cronjob.yaml
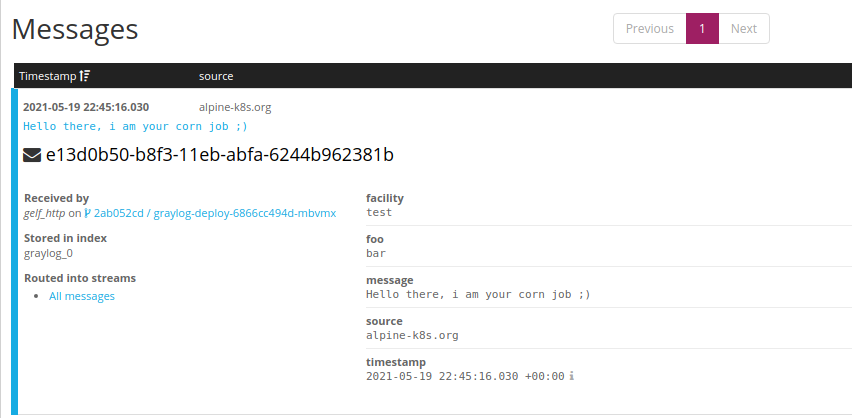
循环向Graylog发送log: curl -XPOST http://graylog3:12201/gelf, inside cluster
1 | { |
Demo log message包含了GELF mandatory fields: short_message和host(似乎不加version也被接受)
可以从Graylog dashboard看到log message:
Config Fluentd to send log message
直接向Graylog发送log message成功,接下来我们加入Fluentd:
- Container产生log到stdout, 被docker logging driver捕获,写入到host的
/var/log/containersfolder - Fluentd监视
/var/log, 发送日志到Graylog, via GELF TCP, port 12201
首先Clean up:
1 | k delete -f log_generate_cronjob.yaml |
删除Graylog GELF HTTP input, 并Create GELF TCP input
Deploy Fluentd Daemonset: 关键config
1 | containers: |
令Fluentd向Graylog server发送log message, via TCP port 12201. 这里采用默认Fluentd配置.
Create daemonset: k apply -f fluentd_daemonset.yaml
观察Graylog, 发现有新的log:
对比我们发送的logging message:
1 | { |
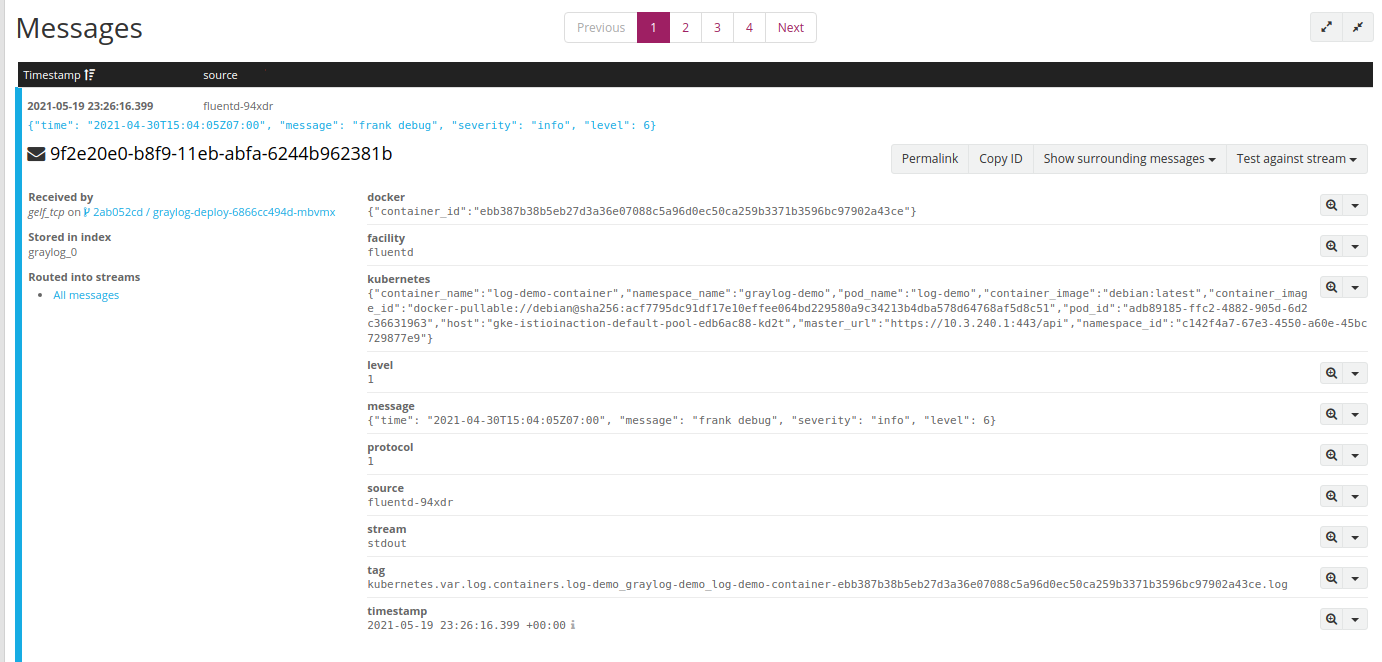
一些有趣的现象:
- 多了一些fields, 添加docker, k8s metadata:
-
docker -
kubernetes -
source -
stream -
tag: tag added by Fluentd
-
- 同时发现我们的JSON log message, 作为string存在
messagefields, expected, 因为Docker logging driver作了转换: 从STDOUT获取的每一行,无论format, 都作为string;
我们需要能从Docker logging driver记录的log unpack 我们的fields, 因此需要进一步配置Fluentd.
同时可以SSH登录Node, 验证logging file内容,确实是被Docker logging driver统一处理过:
1 | sudo tail -f /var/log/containers/graylog-deploy-6866cc494d-mbvmx_graylog-demo_graylog3-25783c1d79760b91a6c6d0650524aa6631d02fde25b6c7a5fa63691d79339afe.log |
1 | {"log":"{\"time\": \"2021-04-30 00:21:24.383 +00:00\", \"message\": \"frank debug\", severity: \"info\", level: 6}\n","stream":"stdout","time":"2021-05-19T23:21:00.604887883Z"} |
直接利用GKE的logging solution
GKE默认采用fluent-bit作为logging collector, 并提供logging dashboard, 见Customizing Cloud Logging logs for Google Kubernetes Engine with Fluentd