Fluentd and Graylog logging solution in k8s
Why
搭建于k8s的微服务系统,log aggregation更是一项基本需求: pod随时可能在Node见迁移,找不到原始log文件.
K8s官方并没有给出具体logging solution, 只给出了logging architecture
这里介绍一套我们组在用的solution: Fluentd+Graylog, 配置简单(相比EFK), 且提供对应的golang logging library实现.
即本文解决问题: 收集golang backend产生的日志,并aggregate到graylog.
本Logging solution的high level workflow
- app pod产生日志,由k8s写入node的
/var/log/containersfolder下 - Fluentd作为daemonset, 运行于k8s cluster, parse log under
/var/log/containers - Fluentd获取log作为input,经过内部workflow: filter, match, output, 最终将日志发送给Graylog(通过TCP 协议)
- Graylog 从listen的TCP port, 获取log消息,建立ES索引,并能从Graylog dashboard看到对应logging message.
本主题将分解为系列博客:
本文代码测试环境:
- GKE 1.17
- Istio: 1.7
- Fluentd: 1.12.3
Introduction to Fluentd
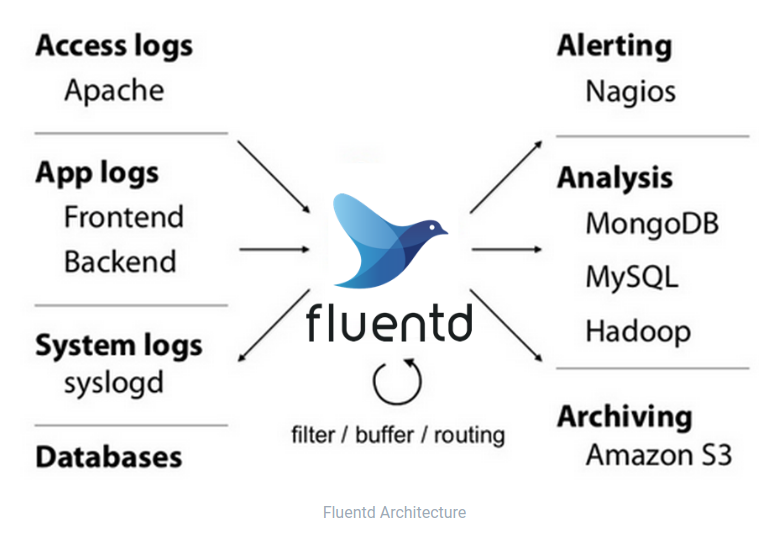
从官方架构图可看出,Fluentd作为适配input(主要是各种logging message), output(多种多样: 各种持久化数据库,monitoring system)的中间件, 提供可定制化的: filter, routing, parse, buffer, format等; 最终实现input, output解耦.
Fluentd由Ruby实现,生态里包含很多开源Plugin.
Fluentd接受到的data, 化为内部的event
A Fluentd event’s lifecycle
本地测试环境
1 | version: '3.2' |
Fluentd conf:
1 | <source> |
- 配置HTTP 输入(plugin
in_http): 根据不同路径赋予label - Match label, 并输出到stdout(plugin
out_stdout) - Fluentd将不同Plugins组装成message processing pipeline
A HTTP event’s life cycle
任何Fluentd的输入都被转化为一系列events, event结构:
-
tag: 表明events的origin, 用于后续message routing -
time: event到达的timestamp -
record: actual message payload
整个lifecycle一般分为如下几步:
0. Setup: config Fluentd, 设置好pipeline
- Input: 配置input plugin, 获取输入; 不同的输入有不同的
tag - Filter: filter和rewrite events
- Matches: match label, 并通过output plugin, output
这里通过HTTP event来阐述life cycle, input一个event via HTTP:
1 | curl -i -X POST -d 'json={"action":"login","user":2}' http://localhost:8888/test.cycle |
Fluentd输出:
1 | fluentd_1 | 2021-05-17 22:47:54.452096657 +0000 test.cycle: {"action":"login","user":2} |
- tag: test.cycle, from URL path
-
record: 实际输入
Input from log file
sample_log/source_photos.log 几条取自app的json log:
通过input plugin: in_tail:
1 | <source> |
Source为HTTP输入, 并赋予tag: api.app, 同样match此label, 输出到stdout:
1 | fluentd_1 | 1970-01-01 00:33:41.000000000 +0000 api.app.var.log.source_photos.log: {"elevation":0,"latitude":-27.4748854,"longitude":153.0279261,"message":"Metadata Request Query Parameters","request-id":"bb5988fe-39df-4dea-b820-acd828368c3c","severity":"info","surveyID":"a8f9130c-b1be-11ea-b13b-f32156d4454a","url":"https://api-qa.nearmapdev.com/photos/v2/surveyresources/100-a8f9130c-b1be-11ea-b13b-f32156d4454a/photos/ground/153.0279261,-27.4748854/metadata.json?apikey=xxx"} |
Labels to jump in message pipeline
一般message会根据top-down依次走完config定义好的各步骤, 如果想”跳跃”pipeline, 需要Fluentd的labels机制.
1 | <source> |
- 在Source中指定label
- Source完毕直达label section, 跳过filter步骤
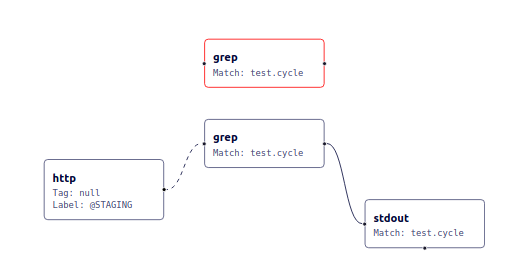
可用calyptia来visualize Fluentd/FluentBit’s config
Docker logging driver
Application容器化之后,程序输出到stdout, stderr的内容会被docker logging driver捕获并处理. 假设fluentd container name为fluentd_1_fluentd_1
docker logs fluentd_1_fluentd_1, 同样可以看到输出到stdout的logs, 参见View logs for a container or service
Docker logging driver支持多种模式, 见Configure logging drivers
Kubernetes下,一般默认config为json-file, 即docker logging driver捕获STDOUT, STDERR输入,写入到json文件:
One line per log, 默认不支持multiline log
Json file logging driver写入format会对捕获的message进一步封装: 无论log的格式是什么,将其作为string, 每行转化为一个json, 包含3 fields:
log,stream,time.1
2
3
4
5{
"log": "Log line is here\n",
"stream": "stdout",
"time": "2019-01-01T11:11:11.111111111Z"
}json-file并不指期待输入的log format为json, 而是将每行内容转化为jsondocker info --format '{{.LoggingDriver}}'用来查看docker配置的logging driver.
Send logs to remote backend
Fluentd作为logging的关键一环,最终目的是将log发送给remote logging backend, 常见的有:
- EFK stack(Elasticsearch + Fluentd + Kibana): Fluentd发送给Elastic Search, Kibana作为UI.
- Graylog: 本身提供UI, 后端采用ES及mongodb.
官方文档提供了将Log直接送到EFK的container, 见这里
Resource
deployment on k8s
fluentd-kubernetes-daemonset
建好的Graylog docker